KPI Dashboard & Analytics Platform
A dashboard leadership actually uses does not fail on the charts. It fails the first time a number is wrong and nobody can say why. A national 3PL had data across five systems and no single place to see how the business was doing, so I built the platform that pulls it together.
An ETL pipeline into a Postgres warehouse, feeding an executive dashboard that finally gives leadership one trusted view. Almost all of the work sits upstream of anything you can see.
The problem
The leadership team's own words: they had never had good KPI reporting.
The numbers they needed lived in five separate tools, each owned by a different part of the business. Operations data in the warehouse system. Support tickets in one place, engineering work in another, labor and scheduling somewhere else, and the sales pipeline in the CRM.
To answer a simple question about how the company was doing, someone had to log into all of them and stitch the answer together by hand. So mostly, nobody did.
What I built
I built a centralized analytics platform from the data layer up. Python ETL scripts pull from each of the five sources on a daily batch refresh and load into a Neon Postgres warehouse.
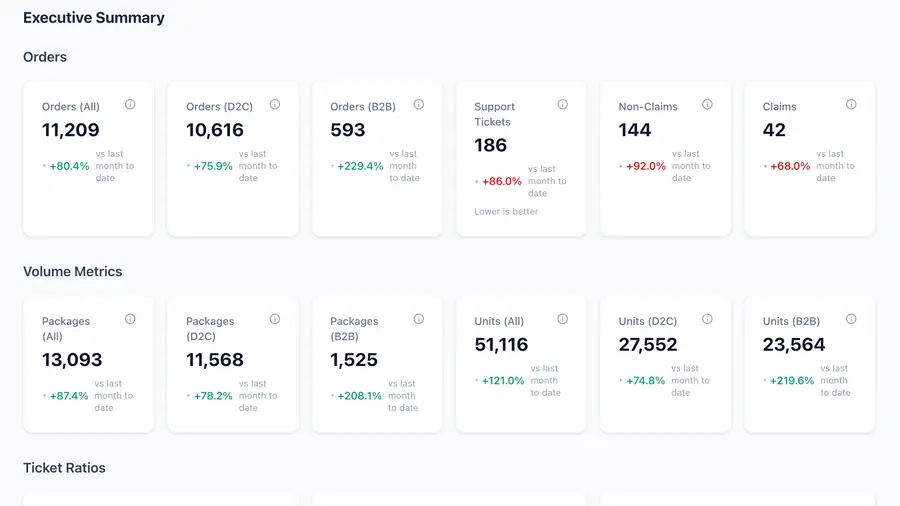
On top of that sits a Next.js dashboard, deployed on Vercel, that turns the raw tables into something leadership actually reads.
- Five sources, one pipeline. A dedicated ETL job per source, each landing clean data into a shared warehouse with fact tables, dimension tables, and a log of every run so I always know what loaded and when.
- 73 KPIs across four views. The dashboard splits into Executive Summary, Operations, Customer, and Sales, so each team sees the numbers that matter to them without wading through the rest.
- Built to be used, not admired. Date range picker, account-level drill-down, charts on real data, and a "last refreshed" timestamp so people know exactly how current the numbers are.
- Privacy by design. Phase 1 ran on record IDs only, no personal data, which kept the build clean and the contract terms easy to clear.
The part that decides whether anyone opens it twice
The interesting part of a project like this is rarely the charts. It is the plumbing.
A leadership team gives a dashboard about one bad number before they go back to asking someone for the real figure. After that you are not fixing a chart, you are trying to win trust back, which is a much longer job.
So the fight is upstream, and every source picked a different one.
The quirks each source threw at me
- API credit limits that forced me to use bulk file exports instead of live queries.
- Encoded IDs that needed decoding.
- Deal stages stored as numeric codes instead of plain text.
is upstream of the interface. Getting reliable, repeatable data flow out of five different systems is most of the work, and it is the part that determines whether anyone ever trusts the dashboard sitting on top.
It is also why there is a "last refreshed" timestamp on the page. Someone reading a stale number without knowing it is stale is worse than no dashboard at all.
Holding a number back on purpose
I also scoped it honestly. Financial KPIs (real labor cost per order, that kind of thing) were deliberately held back until proper role-based access was in place, so warehouse staff and leadership would not see the same numbers.
The data was already flowing. I gated the visibility on purpose rather than shipping something that leaked sensitive figures to the wrong people.
Shipping it would have been faster, and nobody would have flagged it for a while. Slowing down there is a call about people, not about the build.
Why it matters
This was the first time the business had a single, trusted source for its own performance. That is the unglamorous foundation everything else needs.
You cannot manage operations, spot a support problem early, or have an honest conversation about the pipeline when the numbers live in five places and nobody agrees on them.
One warehouse, one dashboard, refreshed every day, is what makes the rest possible.
The charts were the last thing I worried about. Whether a room full of people would still be using it in month three was the first.