Data Infrastructure & Backfill
I cut the oldest history out of the reporting on purpose. It had loaded fine. It just was not real history, and leaving it in would have let people build trends on top of it.
That call is what this page is about. Under it sits the backbone: for a national 3PL, five operational systems pulled into one warehouse, plus the pipelines, the schema, and the historical backfill everything else read from.
The problem
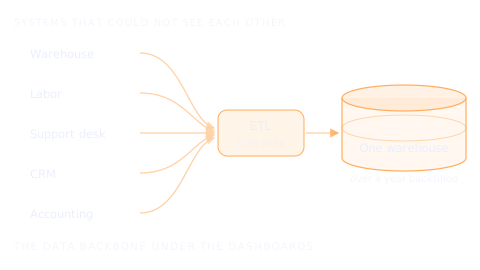
The company's data lived in five different tools that did not talk to each other.
- The warehouse management system held operations and worker activity.
- A help desk tool held support tickets.
- The CRM held deals and accounts.
- A workforce tool held labor and scheduling.
- A project tracker held engineering work.
Each one had its own login, its own export format, and its own idea of what a date or an account even was.
Asking a single question that crossed two of them meant pulling exports by hand and stitching them together in a spreadsheet, which nobody had time to do or trust.
As one stakeholder put it, they had never really had good reporting. The reason was not a lack of dashboards. It was that there was no single, clean place for the data to live.
What I built
I stood up one PostgreSQL warehouse (on Neon) as the single source of truth, and built Python pipelines to feed it from each system on a nightly schedule.
- One warehouse, five sources. Pipelines pull from the warehouse management system, the help desk, the CRM, the workforce tool, and the project tracker, each one normalized into a shared schema so the data lines up.
- A modeled schema, not a dump. Fact tables for the events, dimension tables for accounts and dates, plus an ETL log table so I could see exactly what loaded and when. SQL views sit on top so the dashboards read clean shapes instead of raw source quirks.
- Versioned migrations. Schema changes ship as numbered SQL migrations, so adding a new module later is a controlled step, not a rewrite.
- A bulk-load path for big history. The warehouse system's live API was rate-limited and too slow for backfill, so I loaded history from its bulk data export (parquet files) instead, and kept the API for smaller incremental pulls. Same loader, two speeds.
The backfill, and where I drew the line
A warehouse with only today's data is not much use. The harder part was loading the past.
When I extended the loader to bring in worker activity and operational events, a single backfill drop carried roughly 19 months of history into the warehouse retroactively, tens of thousands of activity records and the alerts tied to them.
was a decision, not a limit. There was older history sitting there and I went back through it. It did not hold up.
Everything past that line looked like it had been imported in one go rather than accumulated as the business actually ran, and it was not telling anyone anything true.
So I cut it, set the lookback at 19 months, and standardized reporting on that window. Everyone measures the same period, and nobody builds a trend on data that only looks like history.
Bad history does not announce itself. It loads clean, it charts fine, and it quietly makes a flat year look like a trend somebody then plans against.
The trade is not free. Cutting the window costs you data, and there is always a pull to keep it because more looks better in a demo. It buys the only thing that matters more, which is that people believe the number.
That is the part people skip. Loading the past is what turns a live feed into something you can reason about, but only if you are willing to throw out the stretch of the past that is fiction.
You cannot spot a trend, set a baseline, or tell a good week from a bad one otherwise.
One careful call: where labor cost comes from
Two of the systems both reported on the same workers, but only one of them held trustworthy pay data.
How the two systems were split
The warehouse system technically had an hourly-rate field, but in this company's instance it was barely maintained and full of junk values, so I deliberately did not load it.
Instead I used the workforce tool as the source of truth for labor cost, and used the warehouse system only for the link between a worker and what they actually did.
The two systems join on worker identity, so you get reliable cost from one and reliable activity from the other, without ever trusting a bad field.
That is the kind of decision this work is full of. Not every field that exists is a field you should use.
Why it matters
This is the layer nobody sees and everything depends on.
The KPI dashboards, the executive views, the operational drill-downs, all of them are just queries against this warehouse. None of them could exist if the data were still scattered across five tools in five formats.
Consolidating the systems, modeling the schema, and loading the history is the unglamorous part, and it is the part that made the rest possible.
The judgment is the half that never shows up in a schema diagram. Knowing which field to leave out, and which stretch of the past to refuse to report on, is what makes anyone believe the dashboard sitting on top.